AD-302 · Probability and Statistics for Data Science/Unsolved PYQ Paper
AD-302 Probability and Statistics for Data Science - Dec 2025 Question Paper
Under each question, How to answer lists the points an answer should cover, outlined by CampusPrep from the syllabus. Check the details against your textbook.
-
7 MarksaDefine Data Science. Explain the Data Science life cycle.
How to answer
- Define Data Science as interdisciplinary field for extracting knowledge from data
- List life-cycle stages: business understanding, data collection, cleaning, exploration, modeling, evaluation, deployment
- Explain each stage briefly with purpose
- Mention iterative nature and communication/visualization
-
7 MarksbCalculate Arithmetic Mean, Median and Mode for the following data : $10, 12, 15, 18, 20, 25, 30$.
How to answer
- Arrange data and compute sum for arithmetic mean $\bar{x}=\sum x/n$
- Find median as middle $(n+1)/2$-th ordered value
- Assess mode as most frequent value / no mode for distinct values
- Report numerical results
-
7 MarksaCalculate the first four moments of the following distribution about the mean and hence find $\beta_1$ and $\beta_2$.
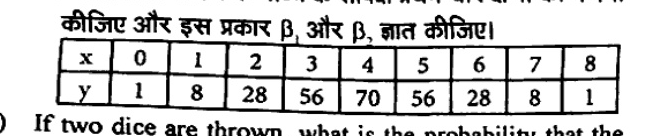
How to answer
- Compute mean $\bar{x}=\sum fx/\sum f$
- Compute central moments $\mu_r = \sum f(x-\bar{x})^r/\sum f$
- Obtain $\mu_1, \mu_2, \mu_3, \mu_4$
- Compute $\beta_1 = \mu_3^2/\mu_2^3$ and $\beta_2 = \mu_4/\mu_2^2$
-
7 MarksbIf two dice are thrown, what is the probability that the sum is (i) greater than 8 (ii) neither 7 nor 11?
How to answer
- Total outcomes $6\times 6=36$ for two dice
- Count favourable cases for sum $>8$
- Count favourable cases for sum neither 7 nor 11
- Compute probabilities as favourable/total
-
7 MarksaFit a second degree parabola to the following data :

How to answer
- Assume second degree parabola $y=a+bx+cx^2$
- Form normal equations $\sum y, \sum xy, \sum x^2y$
- Solve for $a,b,c$
- Write fitted equation
-
7 MarksbDerive mean and variance of the Binomial distribution.
How to answer
- Write Binomial pmf $P(X=r)=\binom{n}{r}p^r q^{n-r}$
- Derive mean $E[X]=np$ using expectation or mgf
- Derive $E[X^2]$ and variance $Var(X)=npq$
- Simplify steps
-
7 MarksaObtain the rank correlation coefficient for the following data :

How to answer
- Rank x and y values, averaging ties
- Compute differences $d$ and $d^2$
- Apply Spearman $\rho =1-6\sum d^2/n(n^2-1)$ with tie correction
- Interpret result
-
7 MarksbFind Karl Pearson's coefficient of correlation from the following :

How to answer
- Compute means $\bar{x}, \bar{y}$
- Compute $r = Cov(x,y)/(\sigma_x \sigma_y)$
- Calculate sums $\sum (x-\bar{x})(y-\bar{y})$, $\sum (x-\bar{x})^2$, $\sum (y-\bar{y})^2$
- Report correlation value
-
7 MarksaA machine which produces mica insulating washers of use in electric device is set to turn out washers having a thickness of 10 mils (1mil=0.001 inch.). A sample of 10 washers has an average thickness of 9.52 mils with a standard deviation of 0.6 mil. Find out t.
How to answer
- Identify $\mu_0=10$, $\bar{x}=9.52$, $s=0.6$, $n=10$
- Use $t=(\bar{x}-\mu_0)\sqrt{n}/s$
- Compute t value
- State degrees of freedom $n-1=9$
-
7 MarksbTwo independent samples of 8 and 7 items respectively had the following values of the variables (weight in ounces). Do the estimates of population variance differ significantly ? Given that for 7 and 6 degrees of freedom the values of F at 5% level of significance is 4.20 nearly.

How to answer
- Compute sample means and variances for Sample I and II
- Form F-ratio of larger to smaller variance estimate
- Compare with critical $F=4.20$ for 7 and 6 d.f. at 5%
- Conclude whether variances differ significantly
-
7 MarksaIf $f(x) = cx^2$, $0 < x < 1$, find the value of $c$ and determine the probability that $1/3 < x < 1/2$.
How to answer
- Use $\int_0^1 f(x)dx=1$ to find $c$
- Integrate $cx^2$ to get $c=3$
- Integrate from $1/3$ to $1/2$ for required probability
- Compute value $19/216$
-
7 MarksbTen coins are thrown simultaneously. Find the probability of getting least seven heads.
How to answer
- Model as Binomial $n=10, p=1/2$
- Use $P(X\ge 7)=\sum_{r=7}^{10}\binom{10}{r}(1/2)^{10}$
- Compute combinations 120+45+10+1
- Divide by 1024
-
7 MarksaWhat is a sampling distribution and what are the uses of sampling distributions?
How to answer
- Define sampling distribution as distribution of a statistic
- Give examples: mean, proportion, variance
- List uses: estimation, hypothesis testing, confidence intervals
- Mention standard error
-
7 MarksbThe average monthly electricity consumption for a sample of 100 families is 1250 units. Assuming the standard deviation of electric consumption of all families is 150 units, construct a 95 percent confidence interval estimate the actual mean electric consumption.
How to answer
- Identify $\bar{x}=1250$, $\sigma=150$, $n=100$
- Use $95\%$ CI $\bar{x}\pm 1.96\sigma/\sqrt{n}$
- Compute margin $29.4$
- Report interval $1220.6$ to $1279.4$
-
7 MarksaFor a distribution, Bowley's coefficient of skewness is -0.56, Q1=16.4 and Median = 24.2. What is the coefficient of quartile deviation?
How to answer
- Recall Bowley skewness $=(Q_3+Q_1-2Median)/(Q_3-Q_1)$
- Substitute $-0.56, Q_1=16.4, Median=24.2$ to solve for $Q_3$
- Compute quartile deviation $(Q_3-Q_1)/2$
- Compute coefficient $(Q_3-Q_1)/(Q_3+Q_1)$
-
7 MarksbDefine Binomial distribution, Poisson distribution and Normal distribution.
How to answer
- Define Binomial with parameters $n,p$ and pmf
- Define Poisson with parameter $\lambda$ and pmf
- Define Normal with mean $\mu$, variance $\sigma^2$ and pdf
- Mention key properties/uses
Go to where you left off?
Quick Add to Notes
Save questions, your own notes and screenshots into notes filed by unit. It takes a free account.
Create free accountHave an account? Log in
Notes Panel