AD-703 (A) · Data Visualization/Unsolved PYQ Paper
AD-703-A Data Visualization - Dec 2024 Question Paper
Under each question, How to answer lists the points an answer should cover, outlined by CampusPrep from the syllabus. Check the details against your textbook.
-
7 MarksaExplain Aggregation and Data Integration in visualization with help of example.
How to answer
- Define aggregation and data integration in visualization context
- Explain aggregation levels/types with example
- Explain integration of heterogeneous sources with example
- Benefits for visualization performance and insight
-
7 MarksbExplain how you will find missing values in heterogeneous data using k-nearest neighbors?
How to answer
- Define missing values in heterogeneous data
- Outline k-nearest neighbors imputation steps
- Distance/similarity for mixed data types
- Example of finding and filling missing value
-
7 MarksaExplain different techniques for Visualizing Complex Data with help of example.
How to answer
- Define complex/high-dimensional data visualization need
- Describe techniques e.g. dimensionality reduction, parallel coordinates, treemaps, network graphs
- Explain each with example
- Comparison of when to use which
-
7 MarksbBriefly explain Pixel-Oriented Visualization Techniques and discuss its benefits.
How to answer
- Define pixel-oriented visualization concept
- Explain techniques e.g. recursive pattern, circle segments, spiral
- Explain how values mapped to colored pixels
- List benefits for large datasets
-
7 MarksaDiscuss Exploratory data analysis techniques with the help of suitable examples.
How to answer
- Define exploratory data analysis (EDA)
- Describe techniques: summary stats, box plots, histograms, scatter plots, correlation
- Give suitable examples for each
- Role in hypothesis generation before modeling
-
7 MarksbExplain the need for Geospatial visualization. List five application where Geospatial visualization is required.
How to answer
- Define geospatial visualization and its need
- Explain handling of location, spatial patterns
- List five applications requiring it
- Example for each application
-
7 MarksaWrite code to plot a line chart to depict the run rate of a cricket match from given data using Matplotlib.
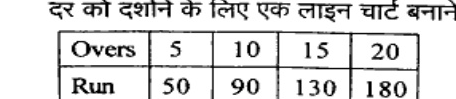
How to answer
- Import matplotlib.pyplot
- Define Overs [5,10,15,20] and Run [50,90,130,180] lists
- Use plt.plot, xlabel, ylabel, title, show/grid
- Complete runnable Python code
-
7 MarksbExplain node-link diagram and force-directed graphs for network visualization.
How to answer
- Define node-link diagram for networks
- Define force-directed layout principle
- Explain working with example
- Advantages and limitations
-
7 MarksaExplain t-Distributed Stochastic Neighbor embedding technique with suitable example.
How to answer
- Define t-SNE purpose for high-dimensional data
- Explain steps: similarity, perplexity, KL divergence optimization
- Give suitable example e.g. MNIST/cluster visualization
- Advantages and limitations
-
7 MarksbWhat do you mean by Confusion Matrix? Explain step by step that how you will calculate confusion matrix with the given data set?
How to answer
- Define confusion matrix and TP,TN,FP,FN
- Steps to construct from predicted vs actual
- Show calculation with example dataset
- Derive accuracy, precision, recall from matrix
-
7 MarksaFor a Given data = $\{ 2, 3, 4, 5, 6, 7 ; 1, 5, 3, 6, 7, 8 \}$, Compute the principal component using PCA Algorithm.
How to answer
- State given 2D dataset and PCA steps
- Compute mean, covariance matrix
- Compute eigenvalues/eigenvectors
- Select principal component and projection
-
7 MarksbWhat is big data analysis? Explain how it will help in data visualization.
How to answer
- Define big data analysis and its Vs
- Explain role in handling volume/velocity/variety for visualization
- Examples of tools/techniques
- How it improves insight and decision making
-
7 MarksaHow can we effectively visualize the text data? Explain with help of the example.
How to answer
- Define challenges of text data
- Describe techniques: word cloud, frequency bar, sentiment, topic models
- Explain with example
- Tools used
-
7 MarksbExplain step by step process of a dashboard creation in Tableau.
How to answer
- Define Tableau dashboard purpose
- List steps: connect data, create sheets, add filters, arrange layout
- Explain publishing/interactivity
- Example workflow
-
14 MarksWrite a short note on any two :
- i)Data cleaning tools
- ii)Hierarchical Visualization Techniques
- iii)Multivariate data visualization
- iv)Data Visualization using R
How to answer
- Select any two topics from i-iv
- Define each with key concepts
- Explain techniques/tools with example
- Uses and diagram where relevant
Go to where you left off?
Quick Add to Notes
Save questions, your own notes and screenshots into notes filed by unit. It takes a free account.
Create free accountHave an account? Log in
Notes Panel